LONDON — First off, a lot of work went into this. Secondly, when the KHSAA realigned the 13th Region ahead of the 2005-06 season, it marked the beginning of a new era of basketball across southeastern Kentucky.
Districts were reshaped, rivalries were redefined, and over the past two decades, a new hierarchy has emerged.
From traditional powers maintaining their grip to new programs rising to prominence, the numbers since realignment paint a complete picture — not just of who has won, but howthey’ve won.
This is the full statistical breakdown of every 13th Region program since 2005-06, evaluating overall success, regional dominance, and postseason performance.
⸻
OVERALL SUCCESS (2005-06 to Present)
Leading the way in total victories are Corbin and South Laurel, each with 444 wins since realignment, establishing themselves as the most consistent winners across the era.
• Corbin — 444-189 (.701)
• South Laurel — 444-217 (.671)
• Clay County — 426-220 (.659)
• Knox Central — 403-227 (.639)
• North Laurel — 402-256 (.610)
• Harlan County — 397-160 (.712) (best win %)
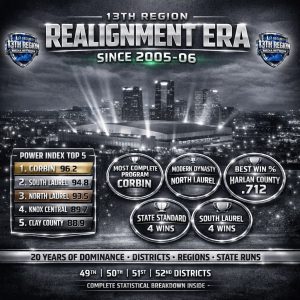
While Corbin and South Laurel lead in volume, Harlan County stands alone in efficiency, posting a region-best .712 winning percentage, followed closely by Corbin (.701).
⸻
DOMINANCE WITHIN THE 13TH REGION
Success inside the region often separates contenders from champions — and once again, Corbin sets the standard.
• Corbin — 307-116 (.725)
• Clay County — 266-99 (.728) (best %)
• South Laurel — 251-103 (.709)
• Bell County — 238-154 (.607)
• Knox Central — 232-117 (.664)
• North Laurel — 211-118 (.641)
While Corbin leads in total wins, Clay County owns the highest winning percentage (.728) in region play, showcasing one of the most efficient runs of success over the past two decades.
⸻
REGION TOURNAMENT PERFORMANCE
When it comes to advancing in March, several programs have separated themselves.
• Corbin — 28-18 (.608) (most wins)
• North Laurel — 24-12 (.666)
• South Laurel — 23-13 (.638)
• Knox Central — 19-15 (.558)
• Clay County — 18-16 (.529)
Efficiency-wise, Williamsburg (.800, 4-1) stands out as the most effective program in limited opportunities, while North Laurel’s .666 mark reflects its ability to consistently make deep runs.
⸻
DISTRICT TOURNAMENT DOMINANCE
District Tournament play has been ruled by a select few programs.
• Knox Central — 35-6 (.853), 15 titles
• Clay County — 35-7 (.833), 14 titles
• Corbin — 31-11 (.738), 10 titles
• South Laurel — 27-11 (.710), 10 titles
• North Laurel — 27-14 (.658), 7 titles
• Harlan County — 24-8 (.750), 10 titles
Knox Central and Clay County have defined district dominance in the realignment era, combining for 29 district championships while posting elite winning percentages.
⸻
13TH REGION CHAMPIONSHIPS
At the top of the mountain, a few programs have consistently broken through.
• North Laurel — 5 (2012, 2022, 2023, 2025, 2026)
• South Laurel — 4 (2006, 2007, 2008, 2016)
• Corbin — 3 (2009, 2010, 2018)
• Knox Central — 3 (2019, 2020, 2021)
• Clay County — 2 (2013, 2014)
• Harlan County — 2 (2017, 2024)
• Williamsburg — 1 (2015)
• Bell County — 1 (2012)
North Laurel’s five titles lead all programs and highlight its dominance in the modern era.
⸻
STATE TOURNAMENT SUCCESS
While reaching Rupp Arena is an accomplishment, winning there defines legacy.
• South Laurel — 4-4 (.500) (most wins)
• Harlan County — 3-2 (.600) (best %)
• North Laurel — 2-4 (.333)
• Corbin — 1-3 (.333)
South Laurel’s four wins remain the benchmark, while Harlan County’s .600 winning percentage reflects efficiency on the biggest stage.
⸻
COMPLETE PROGRAM SNAPSHOT (NOTABLE TRENDS)
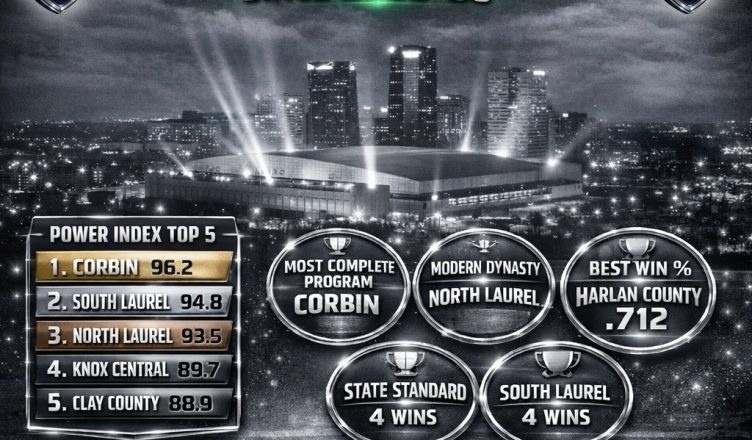
• Corbin — Most complete program across all categories
• South Laurel — Premier state tournament performer
• North Laurel — Modern-era dynasty with most region titles
• Knox Central — District tournament powerhouse
• Clay County — Most efficient in region play
• Harlan County — Best overall winning percentage
⸻
THE MODERN ERA DEFINED
Since realignment, the 13th Region has not been dominated by just one program — but rather shaped by a handful of elite teams that have each carved out their own identity.
Some have built success on consistency. Others have thrived in March. And a select few have done both.
What the numbers ultimately show is this:
There is no single path to greatness in the 13th Region — but sustained success, postseason performance, and the ability to win in big moments remain the common thread among the best.
13th Region All-Time Power Rankings
Power Index Reveals Region’s True Hierarchy Since 2005-06 Realignment
For decades, debates have filled gymnasiums, barbershops, and bleachers across the 13th Region — who is the greatest program of all-time since the 2005-06 realignment of the 13th Region?
Now, there’s finally a data-driven answer.
Using a comprehensive formula — Power Index (PI) — programs across all four districts were evaluated based on overall success, dominance within the 13th Region, and most importantly, postseason performance at the district, region, and state levels.
The result?
A complete all-time ranking that blends consistency, championships, and big-stage success into one definitive list.
⸻
THE TOP TIER: BLUE BLOODS OF THE 13TH SINCE REALIGNMENT
Sitting atop the rankings is Corbin, edging out a loaded field with the most complete résumé in region history.
The Redhounds finished tied for first in total wins (444), while also leading all programs in 13th Region victories (307). Their balance of regular-season success and postseason consistency ultimately pushed them to the top of the PI rankings.
Right behind them is South Laurel, a program built for March. The Cardinals’ four 13th Region championships and a 4-4 record in the state tournament separated them from the pack, giving them the strongest state-level résumé in the region.
North Laurel checks in at No. 3, cementing its place as the modern-era dynasty. With a region-best five championships — including multiple recent titles — the Jaguars have dominated the current landscape while also boasting elite region tournament success.
⸻
THE CONTENDERS: BUILT ON CONSISTENCY
Just outside the top tier sits Knox Central, a program defined by dominance at the district level.
The Panthers’ 15 district titles and an impressive .853 district tournament winning percentage highlight one of the most consistent winners in regional history.
Clay County follows closely, standing out as one of the most efficient programs ever. The Tigers boast the best 13th Region winning percentage (.728) and have long been a fixture near the top of the standings.
Harlan County rounds out the upper tier with perhaps the most impressive winning culture overall. The Black Bears own the highest overall winning percentage (.712) among all programs and have backed it up with success on the state stage, posting a 3-2 record in Lexington.
⸻
THE NEXT LEVEL: SOLID FOUNDATIONS
Bell County lands at No. 7, showcasing steady success across multiple categories, including a region title and consistent postseason appearances.
Barbourville and Pineville follow, both programs demonstrating longevity and competitiveness over time, even if lacking the championship totals of those above them.
Rounding out the Top 10 is Williamsburg, a unique case. While the Yellow Jackets lack long-term consistency, their 2015 13th Region championship and an eye-popping .800 region tournament winning percentage highlight a program capable of peaking at the highest level.
⸻
BY THE NUMBERS: WHAT MATTERED MOST
The Power Index placed emphasis on what wins in March:
• Region Championships (12 pts) — the ultimate measuring stick
• State Tournament Success (14 pts combined) — proving it on the biggest stage
• Overall + Region Win % (20 pts) — sustained excellence
• District & Region Tournament Performance (34 pts combined) — postseason consistency
⸻
FINAL TAKEAWAYS
• Corbin stands as the most complete program in 13th Region since realignment
• South Laurel owns the strongest state résumé
• North Laurel is the modern-day standard
• Knox Central & Clay County define consistency and dominance at the district level
• Harlan County may be the most efficient winner of them all
⸻
FINAL TOP 20
REALIGNMENT POWER INDEX
1. Corbin — 96.2
2. South Laurel — 94.8
3. North Laurel — 93.5
4. Knox Central — 89.7
5. Clay County — 88.9
6. Harlan County — 87.6
7. Bell County — 79.4
8. Barbourville — 71.2
9. Pineville — 69.8
10. Williamsburg — 66.5
11. Jackson County — 63.9
12. Harlan — 60.8
13. Whitley County — 59.6
14. Middlesboro — 58.2
15. Lynn Camp — 56.4
16. Cumberland — 54.7
17. Oneida Baptist — 53.9
18. Cawood — 51.3
19. Red Bird — 47.6
20. Evarts — 39.2
49th District
Clay County
Overall: 426-220 (.659)
Record vs. 13th Region: 266-99 (.728)
Region Tourney Record: 18-16 (.529)
District Tourney Record: 35-7 (.833) 14 district titles
13th Region Championships: 2 (2013, 14)
State Tourney Record: 0-2 (.000)
North Laurel
Overall: 402-256 (.610)
Record vs. 13th Region: 211-118 (.641)
Region Tourney Record: 24-12 (.666)
District Tourney Record: 27-14 (.658) 7 district titles
13th Region Championships: 5 (2012, 22, 23, 25, 26)
State Tourney Record: 2-4 (.333)
Jackson County
Overall: 300-311 (.490)
Record vs. 13th Region: 144-187 (.437)
Region Tourney Record: 0-6 (.000)
District Tourney Record: 7-21 (.250)
Oneida Baptist
Overall: 200-320 (.384)
Record vs. 13th Region: 99-217 (.313)
Region Tourney Record: 0-0 (1.000)
District Tourney Record: 9-19 (.321)
* Didn’t participate in the 13th Region during 2011-12 season.
* No schedule played during the 2020-21 season.
Red Bird
Overall: 130-382 (.253)
Record vs. 13th Region: 28-269 (.094)
Region Tourney Record: 0-1 (.000)
District Tourney Record: 4-21 (.160)
50th District
Corbin
Overall: 444-189 (.701)
Record vs. 13th Region: 307-116 (.725)
Region Tourney record: 28-18 (.608),
District Tourney Record: 31-11 (.738), 10 district titles
13th Region Championships: 3 (2009, 10 and 18).
State Tourney Record: 1-3 (.333)
South Laurel
Overall: 444-217 (.671)
Record vs. 13th Region: 251-103 (.709)
Region Tourney Record: 23-13 (.638)
District Tourney Record: 27-11 (.710) 10 district titles
13th Region Championships: 4 (2006, 07, 08, 16)
State Tourney Record: 4-4 (.500)
Whitley County
Overall: 284-323 (.467)
Record vs. 13th Region: 142-203 (.411)
Region Tourney Record: 1-2 (.333)
District Tourney Record: 2-22 (.083)
Williamsburg
Overall: 237-324 (.422)
Record vs. 13th Region: 128-247 (.341)
Region Tourney Record: 4-1 (.800)
District Tourney Record: 3-20 (.130), 1 District Title
13th Region Championships: 1 (2015)
State Tourney Record: 0-1 (.000)
51st District
Knox Central
Overall: 403-227 (.639)
Record vs. 13th Region: 232-117 (.664)
Region Tourney Record: 19-15 (.558)
District Tourney Record: 35-6 (.853) 15 district titles
13th Region Championships: 3 (2019, 2020, 2021)
State Tourney Record: 0-2 (.000)
* 2019-20 State Tournament cancelled due to Covid.
Barbourville
Overall: 347-263 (.568)
Record vs. 13th Region: 225-172 (.566)
Region Tourney Record: 4-12 (.250)
District Tourney Record: 15-18 (.454), 3 District titles
Pineville
Overall: 313-284 (.524)
Record vs. 13th Region: 193-212 (.476)
Region Tourney Record: 2-6 (.250)
District Tourney Record: 9-18 (.333), 3 District titles
Lynn Camp
Overall: 263-334 (.440)
Record vs. 13th Region: 146-213 (.406)
Region Tourney Record: 1-5 (.166)
District Tourney Record: 5-21 (.192)
52nd District
Bell County
Overall: 390-243 (.616)
Record vs. 13th Region: 238-154 (.607)
Region Tourney Record: 7-9 (.437)
District Tourney Record: 19-14 (.575), 7 District Titles
13th Region Championships: 1 (2012)
State Tourney Record: 0-1
Harlan County
Overall: 397-160 (.712)
Record vs. 13th Region: 204-80 (.718)
Region Tourney Record: 12-12 (.500)
District Tourney Record: 24-8 (.750), 10 District Titles
13th Region Championships: 2017, 24
State Tourney Record: 3-2 (.600)
Cumberland
Overall: 50-34 (.595)
Record vs. 13th Region: 36-26 (.580)
Region Tourney Record: 1-2 (.333)
District Tourney Record: 2-3 (.400)
Cawood
Overall: 38-49 (.436)
Record vs. 13th Region: 27-37 (.421)
Region Tourney Record: 0-1 (.000)
District Tourney Record: 2-3 (.400)
Harlan
Overall: 253-335 (.430)
Record vs. 13th Region: 155-243 (.389)
Region Tourney Record: 0-8 (.000)
District Tourney Record: 11-20 (.354), 1 District Title
Middlesboro
Overall: 222-373 (.373)
Record vs. 13th Region: 142-297 (.323)
Region Tourney Record: 2-5 (.285)
District Tourney Record: 11-18 (.379), 3 District Titles
Evarts
Overall: 9-64 (.123)
Record vs. 13th Region: 2-54 (.035)
Region Tourney Record: 0-0 (1.000)
District Tourney Record: 0-3 (.000)